What is Impression share?
Impression share (IS) is the percentage of impressions that your ads receive compared to the total number of impressions that your ads could get. Impression share is a good way to understand whether your ads might reach more people if you increase your bid or budget.
Formula: Impression share = “Impressions” / “Total Eligible Impressions“
How does Impression share work?
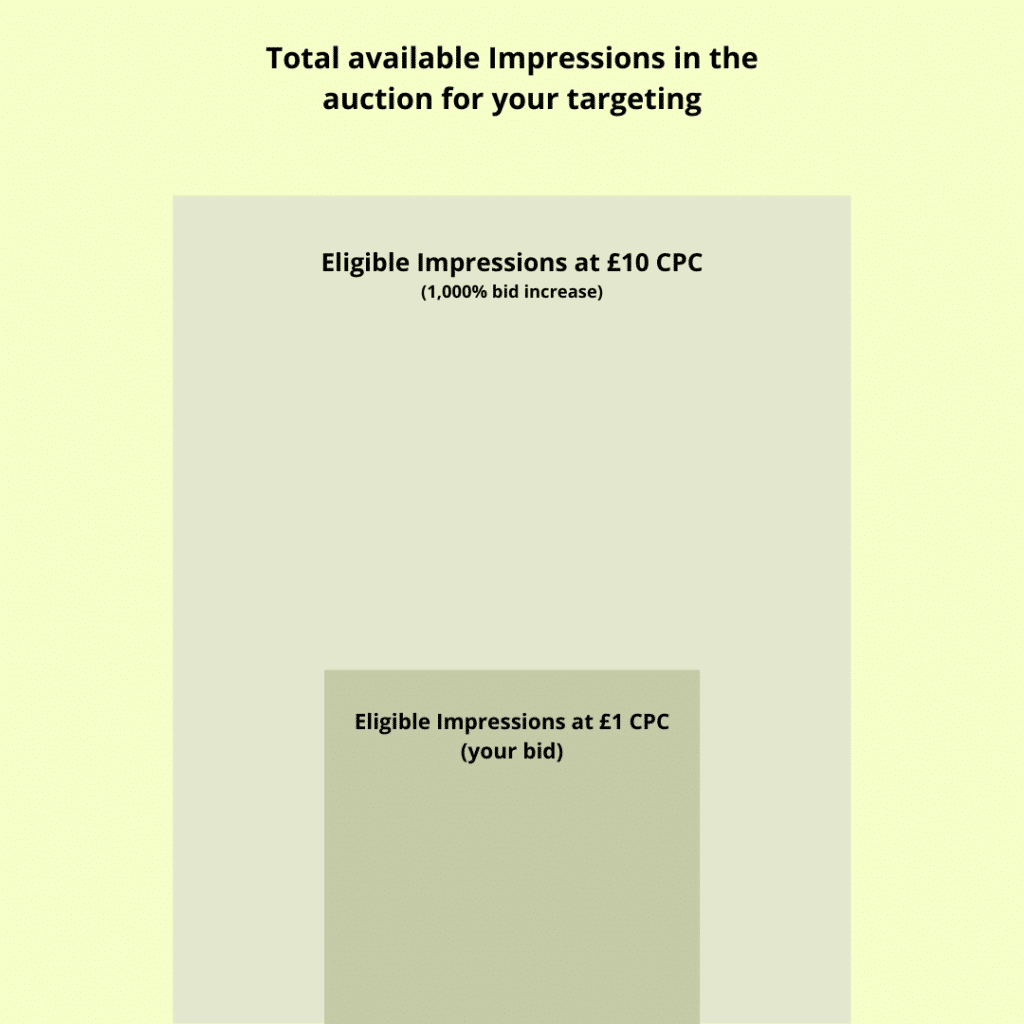
It’s important to understand how it works and according to Google Impression share includes all auctions (impressions) where your ad showed and auctions where it was competitive enough to show (total eligible impressions), but could exclude auctions where your ad needs a 1,000% bid increase to appear.
So the next logical question is – what is the number of Total AVAILABLE Impressions? To save you time and headache I’ve put together the three layers of Impression share in a simple illustration. You can rest in peace now.

Still confused?
Difference between Total Available & Eligible Impressions?
Let’s take this demonstration as an example which I found on clicktrust.be
Impression share = Impressions / Total Eligible Impressions
You increase bids and your formula looks like this:
Impression share + X% = (Impressions + Y) / Total Eligible Impressions
But as you increase bids, you might be eligible for more impressions meaning the correct formula is:
Impression share + X% = (Impressions + Y) / (Total Eligible Impressions + Z)
An increase in bids affects both total eligible impressions and the number of impressions your ads receive so it may result in a higher number of Impressions, but lower Impression Share %, because your Total Eligible Impressions are higher now.
Search Campaigns Impression share
With Search campaigns, it’s straightforward when using Exact and Phrase match because you know what words the search terms should contain. Even though exact is not “exact” anymore, the variations are most often acceptable. Here’s an example of close variants that Google is showing our ads for the exact keyword [cheap memory foam mattress].
80% of the search terms will exactly match the keyword and 20% will be close variations.
It gets a little more difficult with broad match. Google’s showing your ad on searches that are related to your keyword and more importantly keywords that are completely unrelated or way too broad for the term you’ve specified. Have a look at an example of the broad keyword best life insurance and what are the top search terms.
None of them contains the word life which is what we’re interested in and that’s what we’ve specified in the keyword, but Google instead is marching the keyword to insurance related queries which are too broad for what we’re trying to do here. In conclusion, it’s impossible and pointless trying to measure impression share for a broad match keyword because it is causing a lot of waste.
Shopping Campaigns Impression share
For Shopping campaigns it’s more like with broad match type (Broad match lets a keyword trigger your ad to show whenever someone searches for that phrase, similar phrases, close variations of the keyword terms, related searches, and other relevant variations – that is a lot and it can be anything) in Search, you never know what auctions Google might consider you’re eligible for and aiming for 100% IS on your shopping campaigns is not a great idea, unless you’re using query level bidding otherwise you’re wasting ad spend because a good portion of those will be either too generic or irrelevant and you should optimize for ROAS and profit instead.
Key Insights:
- Impression share is a great metric on campaigns that use exact and phrase match keyword types to help you measure the interest over time.
- Comparing two Impression share percentages when you’ve made a change that influenced Total Eligible Impressions doesn’t make sense.
What’s the difference between the Impression share column in the campaign view and the Auction Insights view?
If you’ve been reporting Impression share and Auction insights data, you might’ve noticed slight differences which we’ll cover in this section.
According to Google Ads Help docs:
Sometimes impression share at the campaign and product group level and impression share from auction insights reports may have slight differences. The reason for the slight discrepancy is likely that auction insights filters out auctions with very low impressions, which the campaign level does not (this is to reduce auction insights latency).
so based on the above statement Auction Insights IS should be always higher than campaign / ad group or product group level.
Here’s an example of a Search Campaign
Campaign view

versus Auction Insights view

It’s 74.28% vs 74.19%. Marginal difference. I’m happy with that.
Now same views for a Shopping campaign:

- Date range: July 2021
- Filters: All campaigns, all ad groups
Campaign IS is 28.60% compared to Auction Insights view which is showing 39.20% resulting in a 10% difference with Auction Insights showing higher.

I’ve reached out to Google support for a more detailed explanation and here’s what they said:
The article mentions that the auction insights report “filters out auctions with very low impressions which the campaign level IS does not”.
- X: impressions at the campaign level
- E: Eligible Impressions at the campaign level
- x: Impressions in the auction insights report
- e: eligible impressions in the auction insights report
- It could be X/E < x/e because the auction insights report filters out the auctions with low impressions AND eligible impressions for the auctions with low impressions.
So to sum up, this is expected behavior as Auction insights filter out auctions with low impressions to reduce latency, while the campaign tab shows all eligible data. If you want to get the accuracy, they should refer to the campaign tab report over auction insights.
X/E meaning Campaign view which in our case is 28.60% < is less than x/e which is Auction Insights Impression share at 39.20%.
Key Insights:
- If you’re all about precision then use campaign level IS, but rather than using exact numbers build trend reports which will provide more insight of competitor activity and demand over time.
How much are my competitors spending?
Shopping Campaigns
It’s important to understand that auction insights data visible to you is only relevant to you and not reflective of what your competitor’s paid strategy is. Data you can see applies only to the auctions you were eligible for and if your competitors have their bids set higher or bid on keywords and products which you don’t – you’re not seeing those in the Auction Insights.
We’ll use the below example to calculate how much Amazon has spent on impressions that we were eligible for.

In theory, it should be as simple as:
Take the campaign spend which is £1,150 and apply a simple math calculation
39% (our IS) = £1,150
66% (Amazon IS) = x
Result: x = (£1,150 * 66%) / 39% = £1,946
But that’s not right, because we didn’t account for higher CPCs needed for a higher position which lead to an increase in Impression share. So it could be way way off.
I am in a unique position of managing 2 accounts with the same feed and this exact campaign has spent £1,600 on the other account, but what’s interesting is that its Impression share in the higher spend account is lower and not higher as you’d expect. Why? Simple. Because bidding strategies are different and keywords that both campaigns are eligible for are probably different too (can’t be certain, because one is using Smart Shopping and it doesn’t provide search query data). The lower spend account is using a manual bidding strategy and targets long-tail, product-specific terms and the other account with higher spend is using a Smart Shopping for which I guess terms are more generic. Disappointing. I know.
Search Campaigns
I was curious and compared Total Eligible Impressions in Google Ads and Google Search Console Impressions for a brand term that ranks for most queries in the Top 3. Worth mentioning the campaign in Google Ads is limited by the budget and has a low bid which might be the reason for such a big difference – 4 times less the data Console is reporting, but the trend is similar except for the sharp decline in August on Google Ads which is flat MoM for Organic.

The trend in most instances will be in line with the demand and interest over time.
Key Insights:
- Unfortunately, it’s impossible to estimate a competitors shopping ads spend unless you’re both eligible for the exact same auctions.
- The higher your bid the more impressions you’re eligible for.
What is considered to be a good impression share?
Depends on the type and goal of your campaign. Usually, 90%+ on the brand campaigns and as low as 30%+ on the generic campaigns is decent to give you an idea of where competitors stand and whether increasing the bids will help you drive more sales. If you are happy with current performance and your Impression share is low then aiming for higher is the way to go, but if the impressions you’re getting are not leading to quality traffic then it’s worth looking into negative keywords and/or adjusting your bids to find the right spend vs conversions balance.
Many shopping accounts which I managed in the past had campaigns with low IS – most in the range of 20-30% and some below 10% which is fine and the account was performing well. There was no point in doing query level bidding due to inconsistency in search terms and performance was good with low IS.
Which position is best for traffic and highest profit?
#1 position is best for traffic. It’s obvious. But that doesn’t mean it gets you the highest profit. Users tend to click more on ads that are higher in the search results page encouraging more irrelevant traffic. Users click the ad, just because it’s in the top position without giving much thought or reading what the ad is about and bouncing straight off.
Below is an attempt to measure how ad position affects the conversion rate and bottom-line profit.
Note: No new keywords have been added to the campaign during the test and there are 2 search terms that consumed most of the campaign budget.
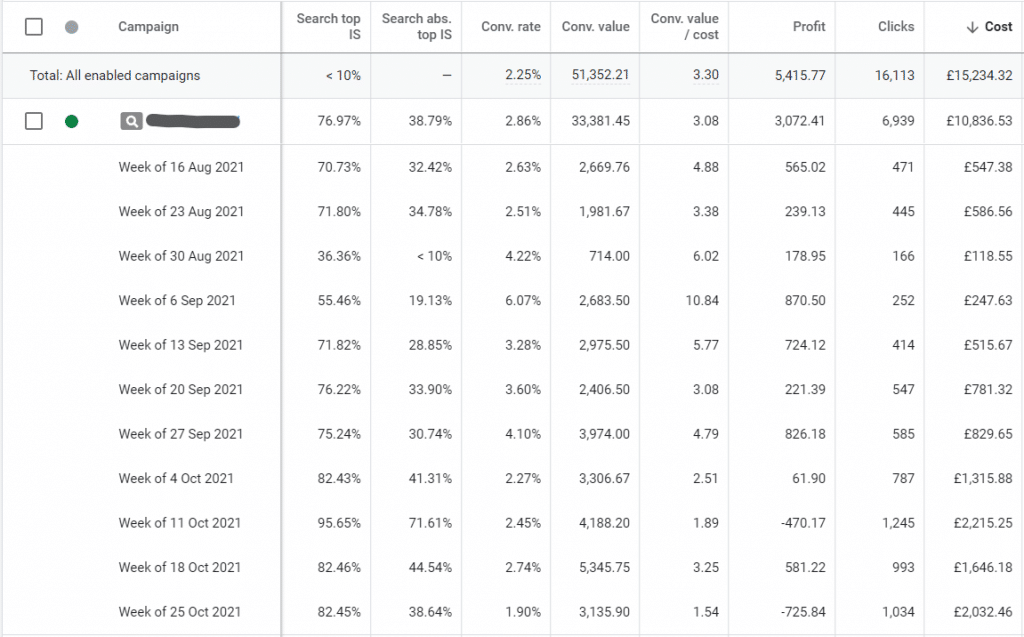
First 2 weeks starting August 16th. Search Top IS at ~70% and Search Abs. Top IS just over ~30%. Conversion rate steady at 2.5%
3rd week August 30th sharp decline in spend from £500/week to £100 causing Search top IS and Search Abs. Top IS to drop to 36% and <10% respectively. Notice how the conversion rate almost doubled from 2.5% to 4.2%.
The following week we’ve increased spend and with that IS metrics go up including the Conversion rate reaching an all-time high of 6%. No particular search terms to call out, the usual. It’s just that some weeks are better than others.
Week of September 13th. This is where the fun begins. We are starting to increase bids and with that, the Spend & Impression Share go up. Fast forward to week of October 11th we said YOLO and increased our spend to £2k reaching a Top IS of 95% and an Abs. Top IS of 71%. Our conversion rate was fine at an average that we were used to 2.5%, but we were not making a profit anymore. Users were buying lower AOV products and ROAS has reached a low of 189%.
We’ve maintained the high spend for 3 weeks as we’re approaching Black Friday and our competitors are getting aggressive with their ads, but unfortunately we are not getting steady results.
So a higher position does not mean a higher profit.

Key Insights:
- Unless you’re working on a brand campaign optimise for performance rather than Impression share.
Impression share metrics. What do all the metrics mean and when you should use them?
For search campaigns, there are 11 metrics.

Search impression share we’ve already defined.
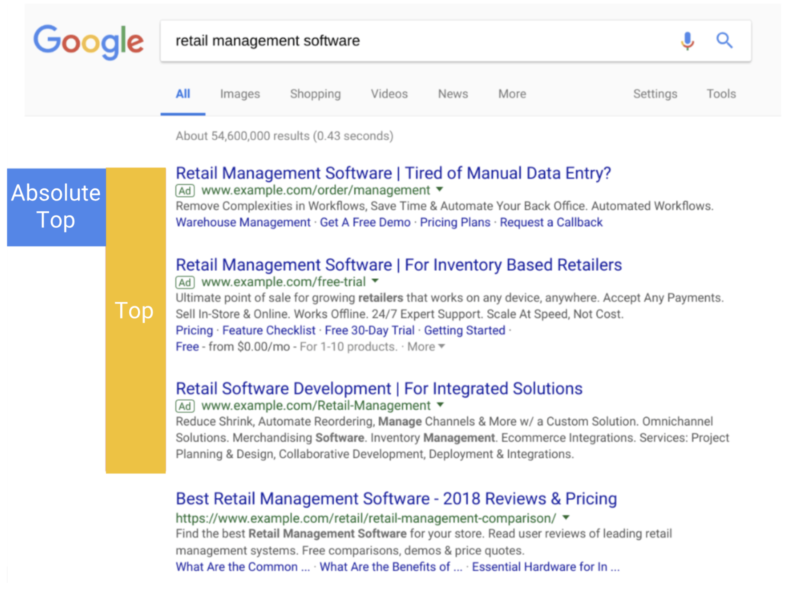
Search top IS – is when ads appear above the organic search results.
Why should you care? Generally, the higher the Search top IS – the higher your CTR is and as a result of that, you’ll get more clicks if that’s what you’re after.
Search abs. top IS – the most prominent position. #1 ad.
This metric is useful because it tells exactly where on the SERP your ad is.

Search lost IS (rank) – the percentage of times your ad didn’t appear in the search results either because your bid is too low or you have poor ad quality (Quality Scores for keywords and Data Feed Quality for shopping ads).
You can use these metrics to understand changes in click-through rate (CTR) caused by a change in the location of your ads on the search result page. We don’t recommend you use these metrics as a target to set your bids because, sometimes, they may decrease as bids increase. This happens as higher bids may allow you to enter more competitive auctions in a worse location. Source: https://support.google.com/google-ads/answer/7501826?hl=en
FAQ
How is the number of impressions you were eligible to receive calculated?
Total Eligible Impressions = “Number of Impressions you received” / “Impression share”. The most important factor is your bid followed by the Quality Score if you’re using keywords and data feed quality if that’s PLA. The higher the bid the more search terms you’re eligible to appear for.
Note: Sometimes when you increase bids in your Shopping campaigns your products enter more competitive auctions which can result in lower IS with higher spend.
Should you spend more? Is there opportunity to drive more revenue at a target ROAS or CPA?
–
Will your conversion rate increase if Absolute top impression share is increasing?
–
Conclusion
Impression share metrics are particularly useful with Brand and Exact Match campaigns where you want to make sure there are no competitors taking over the top spots for the best performing keywords, not as much if you’re a performance-based marketer where you aim to maximize conversions at a given CPA or ROAS target.
It’s a useful metric that helps look at the bigger picture of what’s happening in the market and gives you an idea of where you stand, even if sometimes unprecise, trend views are useful.
Now it’s your turn. Let me know what you think of Google Ads Impression share in the comments below.